Investigate an alert
The alert detail page centralizes all information needed for a deep investigation, including event history, associated tasks, similar alerts, and graph visualization.
Navigate the alert detail page
To open the detail page, click any alert in the Alerts listing.
The header displays the alert urgency, name, and short ID, along with the following actions:
| Action | Description |
|---|---|
| Alert Status | Move the alert through its lifecycle by changing its status. |
| Add to case | Add the alert to a case for an extended investigation. |
| Playbooks | View and trigger available on-demand playbooks. |
Note
Only manual playbooks (with a Manual Trigger) that are enabled in the community appear in the Playbooks list.
The detail page is organized into four tabs: Details, Tasks, Events, and Graph Investigation.
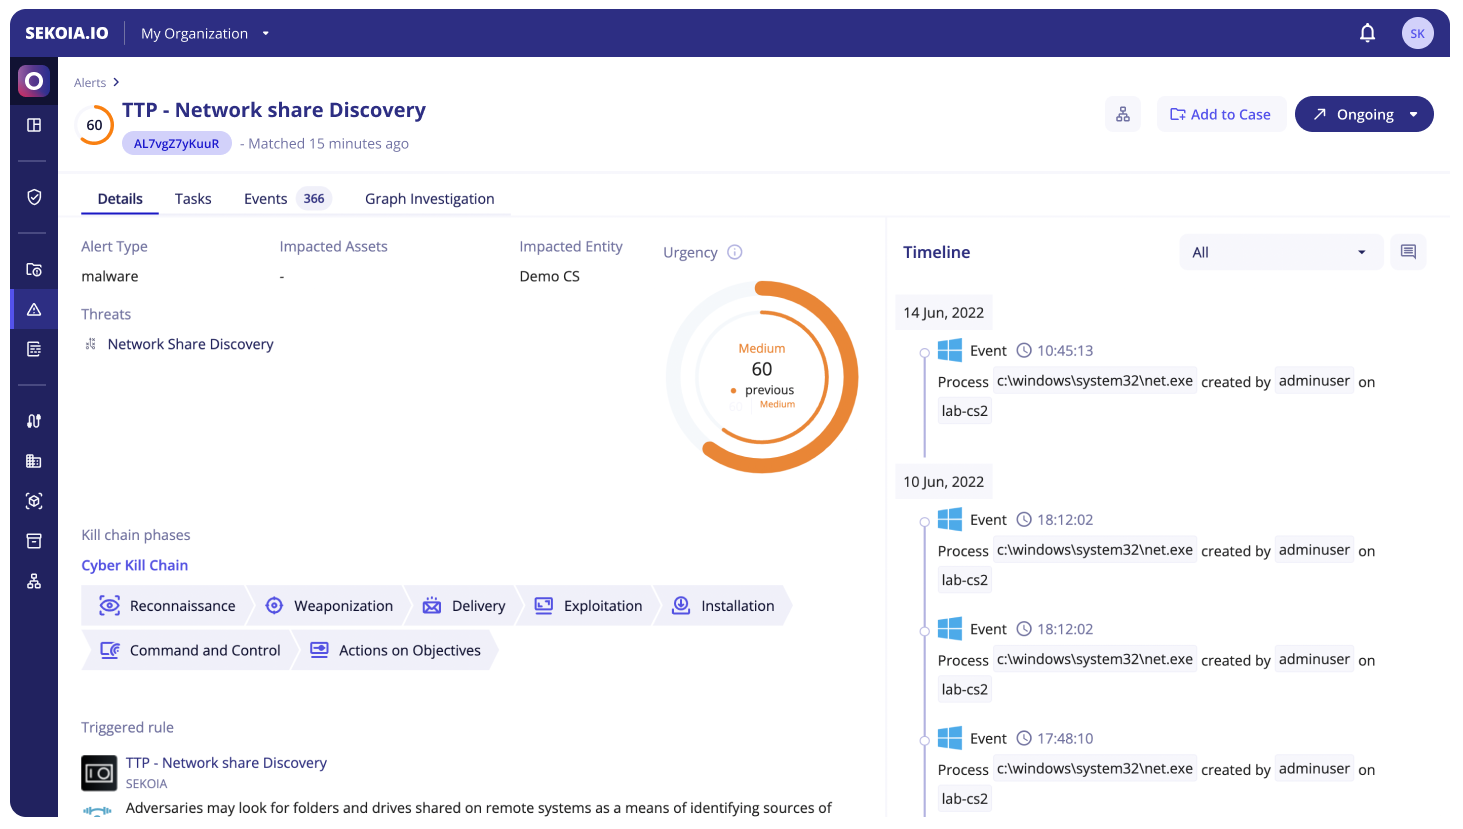
Details tab
The Details tab contains two columns.
The left column includes:
- Alert urgency (editable on hover)
- Alert type
- Impacted assets and entity
- Similarity strategy of the rule
- Related cases
- Kill Chain phase (editable on hover)
- Details about the triggered rule
- Threat intelligence from the Intelligence Center
The right column is the timeline, which contains:
- Alert status changes
- Comments
- Events represented by their Smart Descriptions
- Completed and rejected tasks
You can filter the timeline to display only items of a specific type. To add a comment, click the button in the top-right of the timeline.
Tasks tab
The Tasks tab lists all tasks and subtasks associated with the alert.
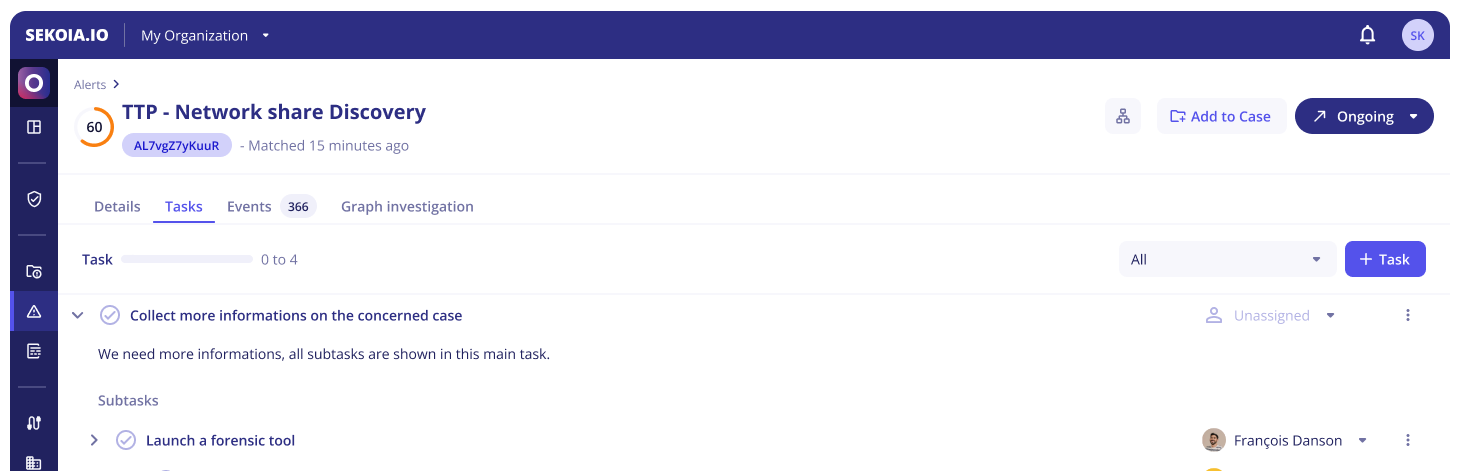
Select Complete or Reject on a task to record the action. Completing a task decreases the alert urgency and the risk indicator.
Note
Subtasks with an OpenC2 specification can be viewed by clicking the automation icon next to the subtask.
Notebook tab
The Notebook tab provides a collaborative workspace to centralize your investigation queries, automation actions, and findings in a single document. Notebooks support markdown syntax, embedded queries, data visualizations, and image attachments.
Note
In a multi-tenant environment, notebooks are created in the parent workspace by default and are not visible to child tenants unless explicitly shared.
You can create a notebook from scratch or apply a pre-defined template tailored to specific threat types (e.g., phishing, malware analysis). A default template can be configured to standardize your team's response process across all alerts.
For full details on templates, formatting commands, PDF export, and sharing, see our Notebooks documentation.
Similar alerts tab
The Similar alerts tab displays all previously recorded alerts that match the current alert's similarity strategy.
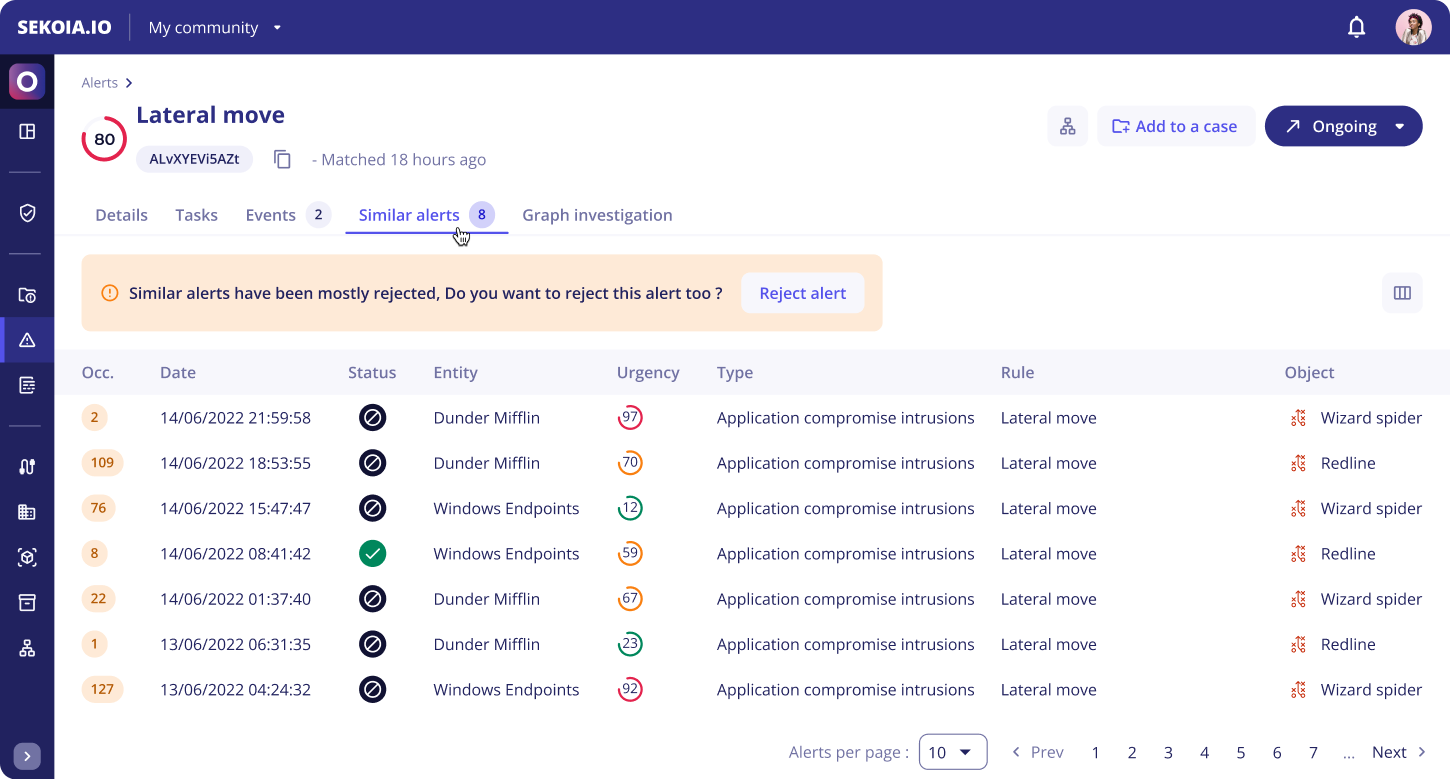
The tab is divided into two sections:
- Suggestion message - A callout summarizing the status of the majority of previous similar alerts, with an action button to apply that status to the current alert (unavailable for alerts in the Closed stage).
- Similar alerts table - A customizable table of all similar alerts. Click the column selector icon to choose which columns to display.
Tip
Click any similar alert to open its detail page, or open several in new tabs to compare them side by side.
Note
If no previous similar alerts exist, a message is displayed to notify you.
Events tab
The Events tab lists all events that triggered the alert.
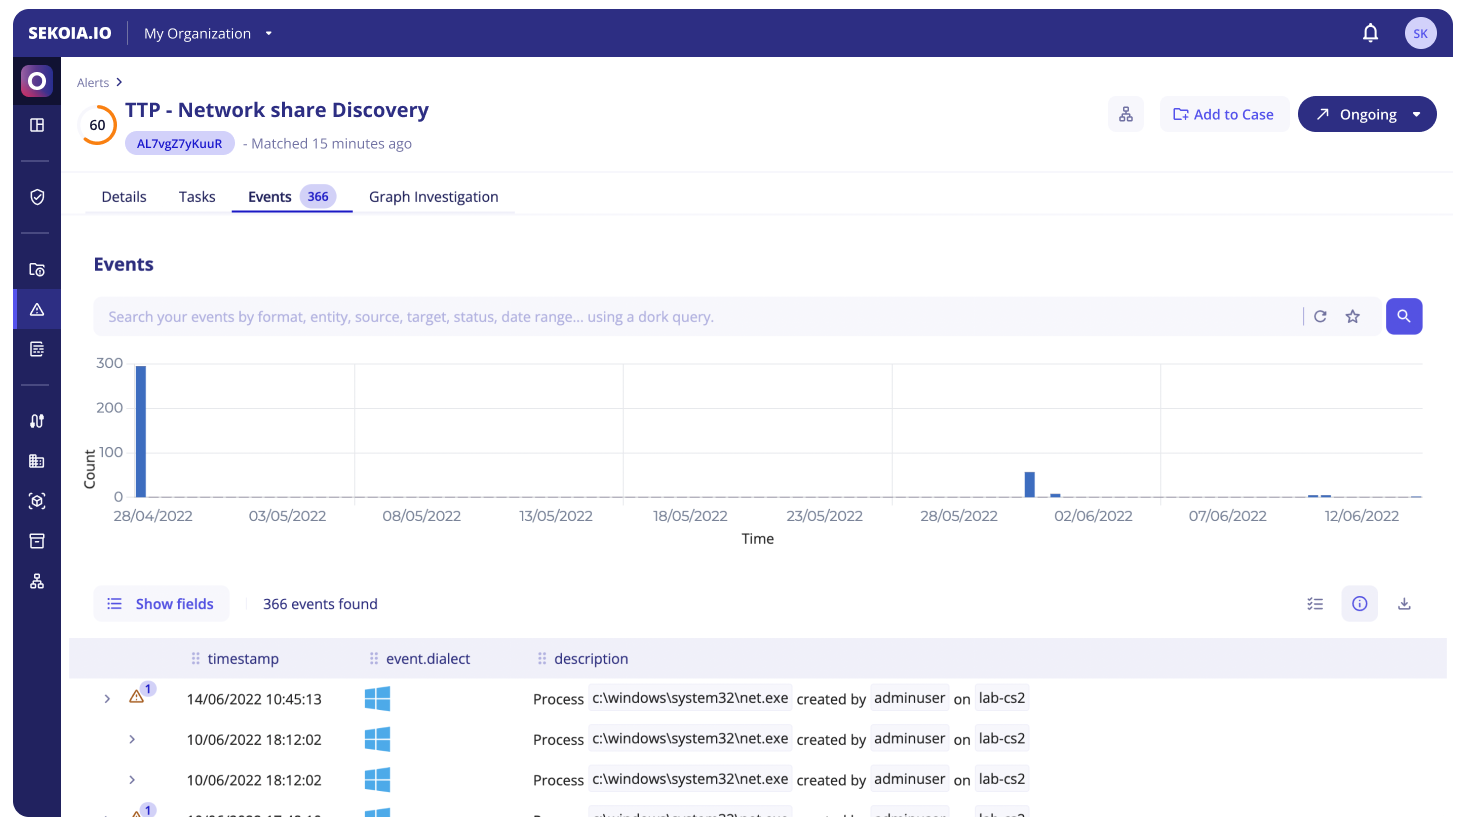
When interacting with an individual value in an event, you can:
- Filter for - Narrow the event list to events matching this value.
- Filter out - Exclude events matching this value.
- Search events with this value - Search all events within the alert timeframe (± 1 hour).
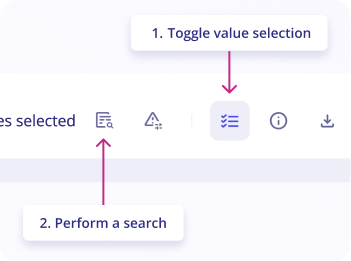
To work with multiple values at once, click Toggle value selection and select values across events. You can then:
- Create an alert filter to suppress future false positives.
- Click Perform a search to open a side panel with results across your environment.
Related articles
- Investigate alerts with Graph: Use visual correlation to analyze complex threats.
- Filter and suppress alerts: Build queries and suppress false positives.
- Manage alerts: Perform bulk actions and status updates.
- Alerts: Understand alert urgency, similarity, and lifecycle logic.