Use the SHC interface
The self-hosted-controller (SHC) opens an interactive terminal user interface (TUI) when you start it without a command. The TUI is the main interface for interactive operations in Self-Hosted 0.1.0: it runs SHC commands and adds live views of your machines, Kubernetes cluster, storage, and platform diagnostics.
The one-shot command-line interface (CLI) remains fully supported. Both interfaces run the same SHC modules, but they serve different workflows:
| Interface | Use it for |
|---|---|
TUI (./run-shc.sh) |
Interactive installation and operations, streamed command output, installation progress, live infrastructure views, and navigable diagnostics. |
CLI (./run-shc.sh <command>) |
Scripts, unattended runs, automation, and commands whose output you want returned directly to the shell. |
Prerequisites
- You have access to the orchestration node.
- The SHC Docker image is loaded and the
run-shc.shexecution script is in place. See Deploy the platform. - Your terminal is attached to a TTY. The
run-shc.shscript in Deploy the platform allocates one automatically when it runs in a terminal. - For the Kubernetes, Storage, and Diagnostics tabs, the cluster is installed and the SHC holds a valid kubeconfig. Run
GetKubeconfigif it does not.
Same commands, two interfaces
The TUI and one-shot CLI share the same command implementation. For example, exec CheckKubernetesCluster runs the same module in both interfaces.
Open the interface
To open the interface, run the execution script with no command:
./run-shc.sh
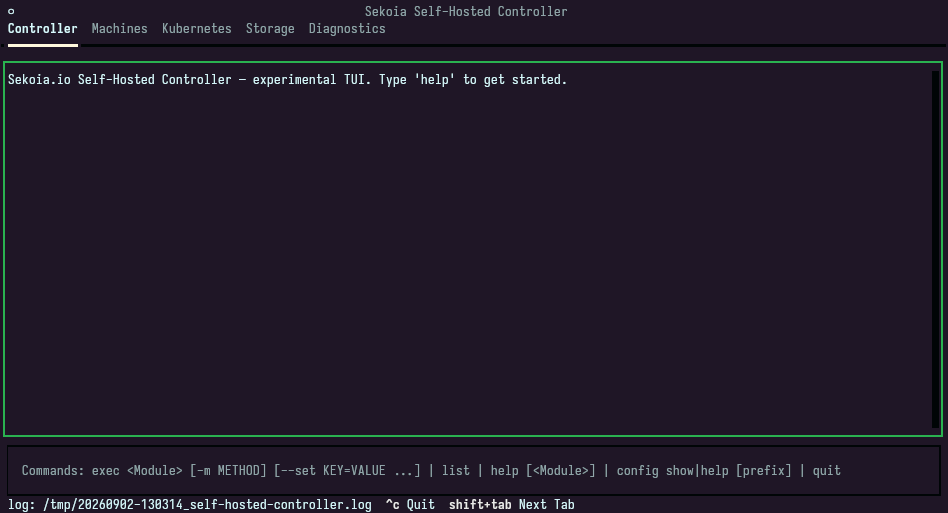
The TUI opens on the Controller tab. Passing a command instead, such as exec, list, help, or config, keeps the SHC in one-shot CLI mode and returns to your shell when the command completes.
Navigate the interface
| Key | Action |
|---|---|
Shift+Tab |
Move to the next tab. |
Ctrl+C |
Quit the interface and restore the terminal. |
Escape |
Return to the target list from a diagnostic result view. |
Shift+Down |
Move to the next diagnostic result panel. |
Shift+Up |
Move to the previous diagnostic result panel. |
Every run writes a timestamped log file, whose path is displayed at the bottom of the interface. Attach that file when you escalate an issue to Sekoia support.
Run a command from the Controller tab
The Controller tab pairs a log panel with a command input. It accepts the same commands as the one-shot CLI:
| Command | Description |
|---|---|
exec <Module> |
Execute a module. |
exec <Module> --set KEY=VALUE |
Execute a module with runtime configuration overrides. |
list |
List the available modules. |
help [<Module>] |
Show the top-level command overview, or the runtime overrides a module accepts. |
config help [prefix] |
Show the configuration reference. |
config show [prefix] |
Render the resolved configuration as YAML. |
quit |
Close the interface. |
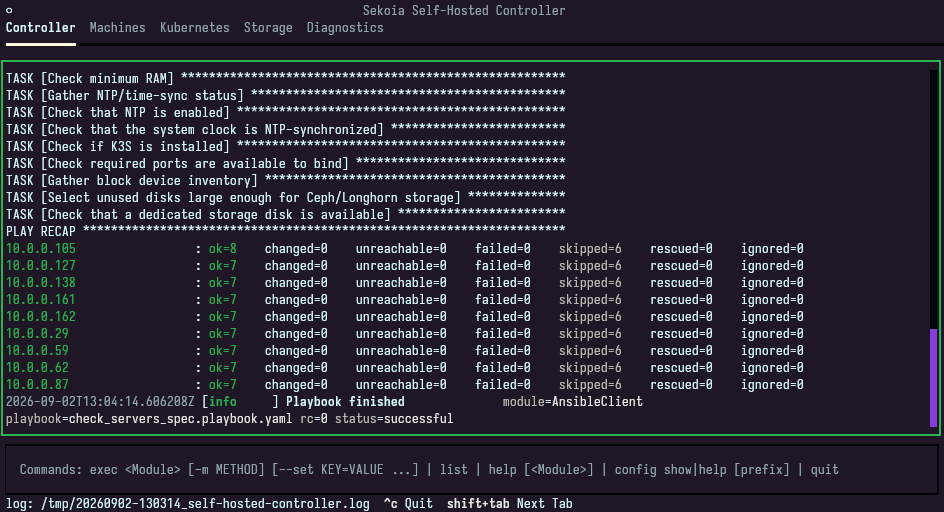
To run a command, enter it in the input and press Enter. Module output and log lines are interleaved in the log panel, in real time.
While you type, the input suggests a matching command. Press Tab to accept the suggestion, and press Tab again to cycle through the other matches. Press Up and Down to browse the commands you already ran.
The interface runs one command at a time. A command submitted while another is still running is rejected rather than queued, and the interface tells you to wait for the first one to finish.
To copy the visible output, right-click the log panel. The interface copies the lines currently in the viewport to your clipboard and confirms with a notification.
Follow the platform installation
While PlatformInstallation runs, a progress bar replaces the command input and reports the completion percentage, the current step, the active provisioner, and the number of completed steps out of the total. The bar disappears when the module completes, and the command input returns.
Read the Machines tab
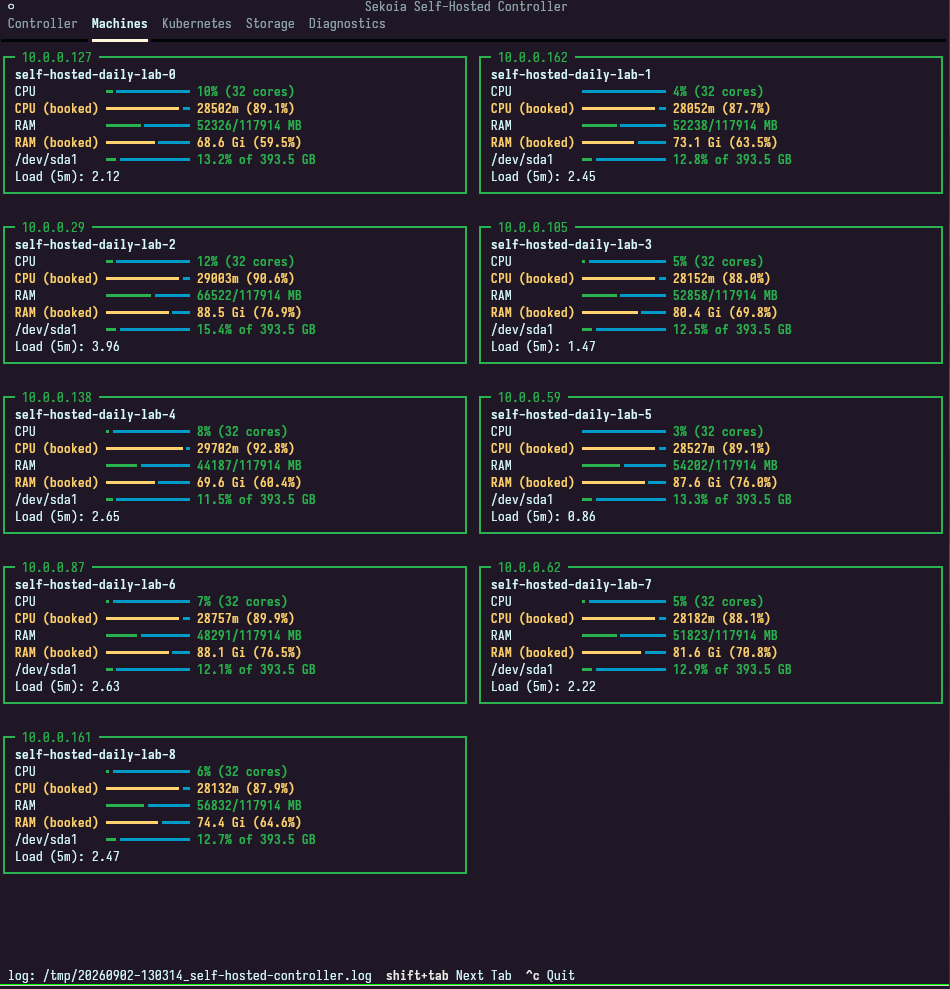
The Machines tab shows one card per host in utils.ansible.inventory, titled with the host address. Each card reports:
- Current CPU and RAM use, total capacity, disk use, and the five-minute load average.
- CPU (booked) and RAM (booked): the CPU and memory requests reserved by Kubernetes workloads on that machine.
Compare booked resources with current use to distinguish sustained workload pressure from capacity already reserved for workloads. High booked values leave less capacity for scheduling new pods even when current use is low.
Bar colors indicate how close a metric is to saturation: green below 70%, yellow from 70%, and red from 90%. A host that cannot be reached is reported as such on its own card.
The cards are laid out on a responsive grid, recomputed when you resize the terminal, and refreshed every 60 seconds. The data comes from the read-only GetServerStatus module, which changes nothing on the hosts.
Read the Kubernetes tab
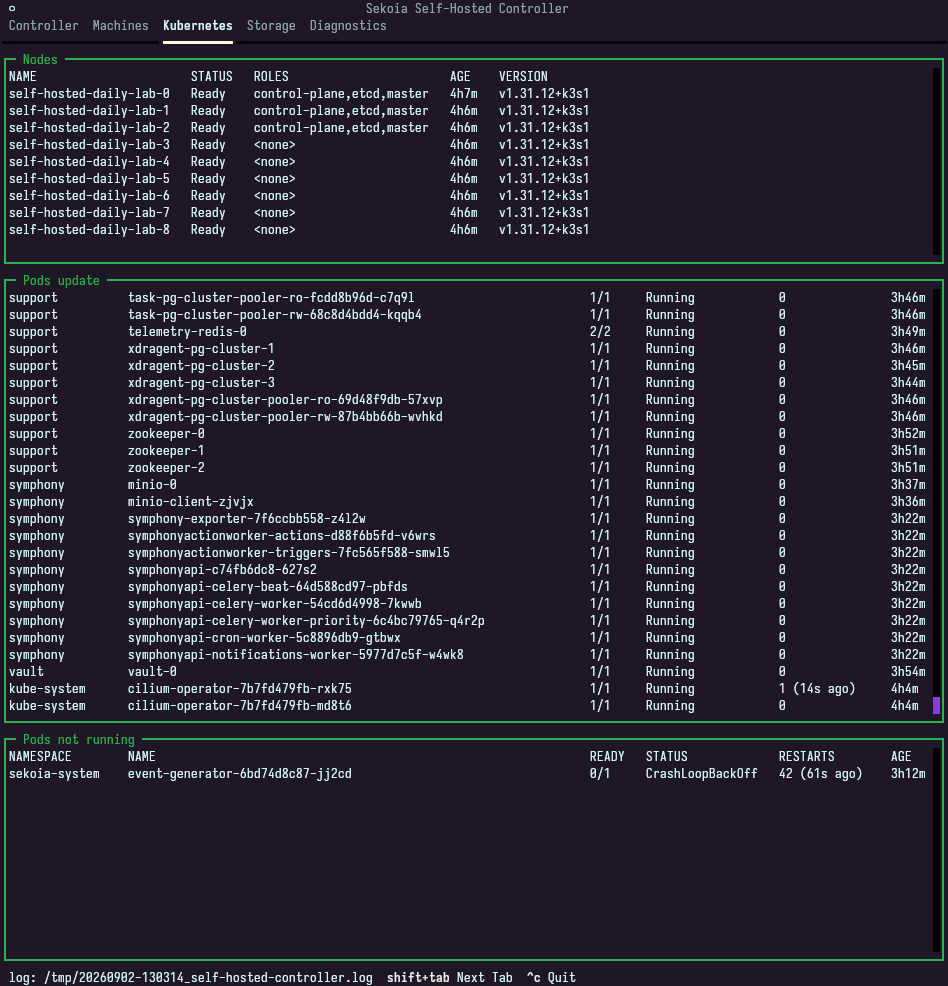
The Kubernetes tab renders three kubectl views of the cluster:
| Panel | Command |
|---|---|
| Nodes | kubectl get nodes |
| Pods update | kubectl get pods -A -w, streamed continuously |
| Pods not running | Every pod that is neither Running nor Completed |
Use the Pods not running panel first when the platform misbehaves: an empty panel means no pod is stuck.
Read the Storage tab
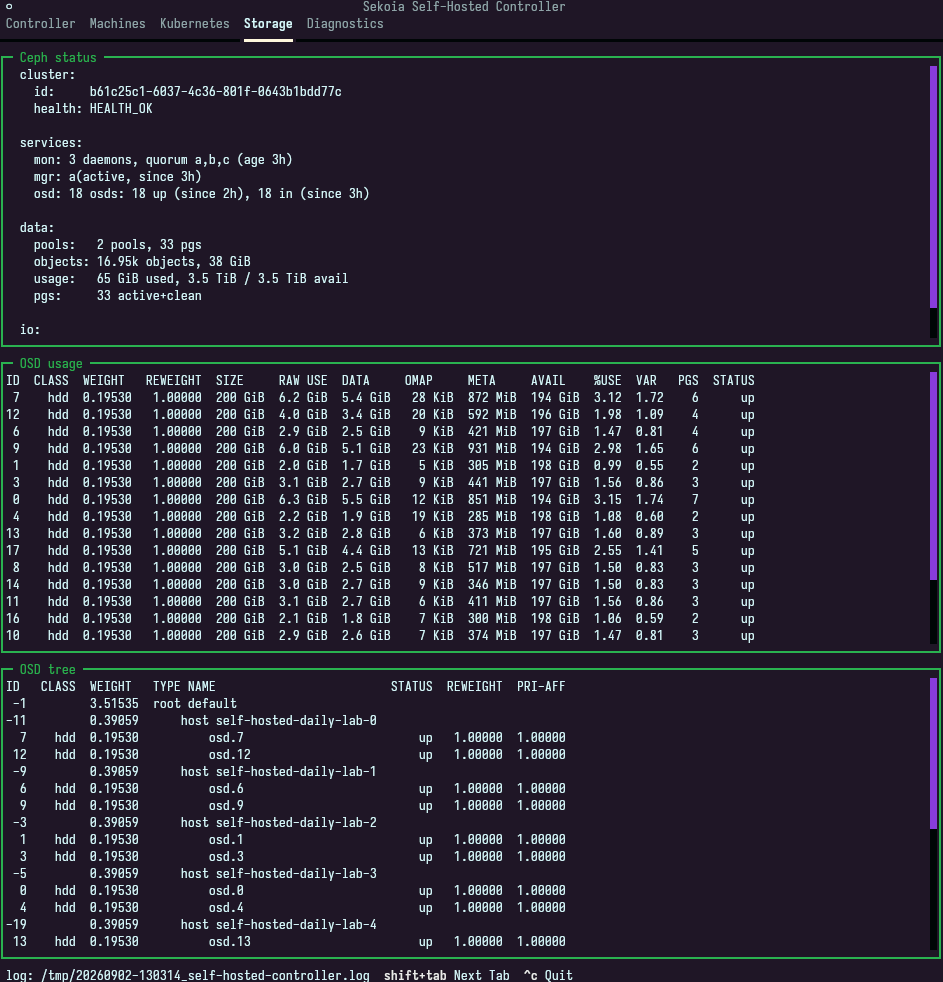
The Storage tab reports the state of the Ceph cluster through three stacked panels, each refreshed every 30 seconds:
| Panel | What it reports |
|---|---|
| Ceph status | Overall cluster health, monitors, managers, OSDs, and current activity (ceph -s). |
| OSD usage | Per-OSD capacity and utilization (ceph osd df). |
| OSD tree | The OSD topology per host (ceph osd tree). |
The panels run against the rook-ceph-tools deployment in the rook-ceph namespace, so they need a healthy cluster and a valid kubeconfig.
Start with Ceph status. A healthy cluster reports HEALTH_OK. If it reports a warning or error, use OSD usage to identify a full or unavailable OSD and OSD tree to locate it on a host.
Run a diagnostic from the Diagnostics tab
The Diagnostics tab lists the diagnostic targets available on the SHC, one per rule file.
To run a target:
- Select the tab with
Shift+Tabuntil Diagnostics is active. - Select a target in the Available diagnostics list and press
Enter.
The interface opens a result view with one collapsible panel per rule of that target, in file order. Each panel starts as NOT_STARTED, switches to RUNNING while its rule is evaluated, and ends on OK, WARN, or CRIT. Rules are evaluated one at a time, and the first panel to reach a result is focused automatically so you can navigate from the keyboard.
A completed panel holds a results table with the measured values and their labels, and a Likely causes & remediation section. Sort the table by selecting a column header. To copy the full report of the current run to your clipboard, right-click the result view or the table.
To return to the target list, press Escape.
No diagnostics listed
When the tab reports that no diagnostics were found, the rule files are missing from the SHC image. Verify the image reference you set in DOCKER_IMAGE, then contact Sekoia support with the path shown in the warning.
When you escalate a diagnostic result, copy the full report and attach the timestamped SHC log shown at the bottom of the TUI. Include the target name and the time at which you ran it.
Result
You can drive the SHC, follow an installation, inspect your machines, cluster, and storage, and run platform diagnostics from one interface without leaving the orchestration node. Use the one-shot CLI when the same operations need to run in a script or unattended process.
Related links
- The deployment process: The modules the SHC exposes and the installation execution plan.
- Run platform diagnostics: The diagnostic targets and how to read a result.
- Debug your deployment: Full SHC debug command reference with remediation steps.
- Monitor your platform: Observability stack and daily monitoring workflows.