Create a SOL detection rule
SOL detection rules let you operationalize your SOL investigation queries as standing detections. This article walks you through creating a SOL detection rule or an Event Drop rule from the rule catalog.
Prerequisites
- You have an active Sekoia.io account with permissions to create detection rules.
- You are familiar with SOL query syntax or have an existing query you want to reuse.
- For Event Drop rules: you have identified the source to monitor (all incoming events, a specific intake, or a specific asset).
Create a SOL detection rule
Step 1: Open the rule creation panel
Navigate to Detection > Rules catalog, then click + New rule.
Step 2: Select the SOL detection pattern
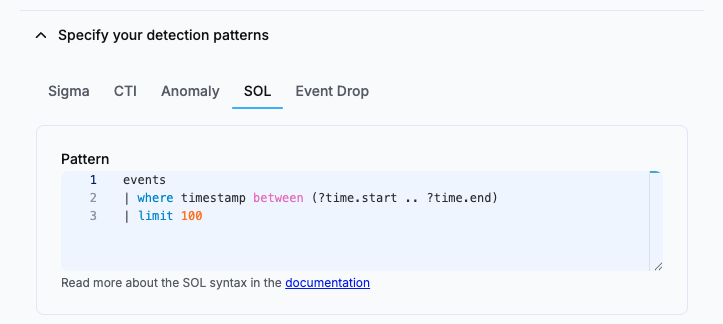
In the Specify your detection patterns section, select the SOL tab. SOL sits alongside the Sigma, CTI, Anomaly and Event Drop patterns.
Step 3: Write your SOL query
In the Query field, enter your SOL query. This is the query that will execute on each scheduled run.
Time conditions are required
Whatever the datasource, your SOL pattern must bound the query with a start and an end time using the ?time.start and ?time.end placeholders. The platform replaces them with each run's time window. A rule whose pattern omits these conditions cannot be saved or executed.
events
| where timestamp between (?time.start .. ?time.end)
| limit 100
Reuse an existing investigation
You can copy a SOL query directly from a Notebook or investigation. Before saving, make sure it bounds the time range with ?time.start and ?time.end.
Result cap
The platform automatically appends a 10,000-row limit to your query. You do not need to add it manually. This is a temporary protective limit and may be raised in the future.
Step 4: Set the run schedule
In the Run query every field, enter a value and select the time unit: minutes, hours, or days. The rule then runs at that frequency.
Minimum schedule interval
The minimum accepted schedule is every 5 minutes.
Late-arriving events
You do not need to widen the schedule to account for ingestion lag. The platform automatically extends each run 5 minutes into the past to catch events that arrive after their timestamp, and deduplicates overlapping results so the same alert is not raised twice. See Lag management for SOL detection rules.
Step 5: Configure the similarity strategy (optional)
By default, all of a rule's matches are grouped into a single alert: each new match increments that alert's occurrence counter instead of creating a separate alert. You do not need to configure anything to get this behavior.
To split matches into separate alerts, configure a similarity strategy by selecting one or more fields. Matches that share the same values for those fields are grouped into one alert, and matches with different values are raised as separate alerts. You can also group interchangeable fields, written as [source.ip, destination.ip], so their values can be swapped when matching.
Similarity for SOL rules
The fields available in the Similarity strategy selector depend on your query. SOL detection rules apply no default similarity strategy based on the datasource, because a SOL rule can query any datasource. See Alert similarity for SOL detection rules to understand the default grouping and when to configure a strategy.
Step 6: Complete the rule metadata
Fill in the remaining rule fields:
| Field | Description |
|---|---|
| Name | A descriptive name for the rule |
| Severity | The severity level assigned to generated alerts |
| Effort | Estimated analyst effort to triage an alert from this rule |
| Threats | Associated threat categories or techniques (MITRE ATT&CK) |
| Description | A summary of what the rule detects and why |
| Tags | Optional labels to help organize and filter rules |
Step 7: Save and activate the rule
Click Create and enable the rule to start executing on the defined schedule.
Create an Event Drop rule
Event Drop rules follow the same creation flow as SOL rules, with the following differences:
- Select the Event Drop detection pattern at step 2.
-
In the Query field, enter the SOL pattern targeting the events, intake or asset you want to monitor for missing data. Like any SOL pattern, it must bound the query with
?time.startand?time.end:events | where timestamp between (?time.start .. ?time.end) | aggregate count() by bin(timestamp, 1d) | where count < 1000000 -
The Threats and security alert classification fields are not available for Event Drop rules, as they apply to threat detection rather than availability monitoring. The Effort field remains available.
Create from an intake or asset
You can start Event Drop rule creation directly from an intake or an asset, with the pattern pre-filled on the source UUID. See Create an Event Drop rule from an intake or asset.
What happens next
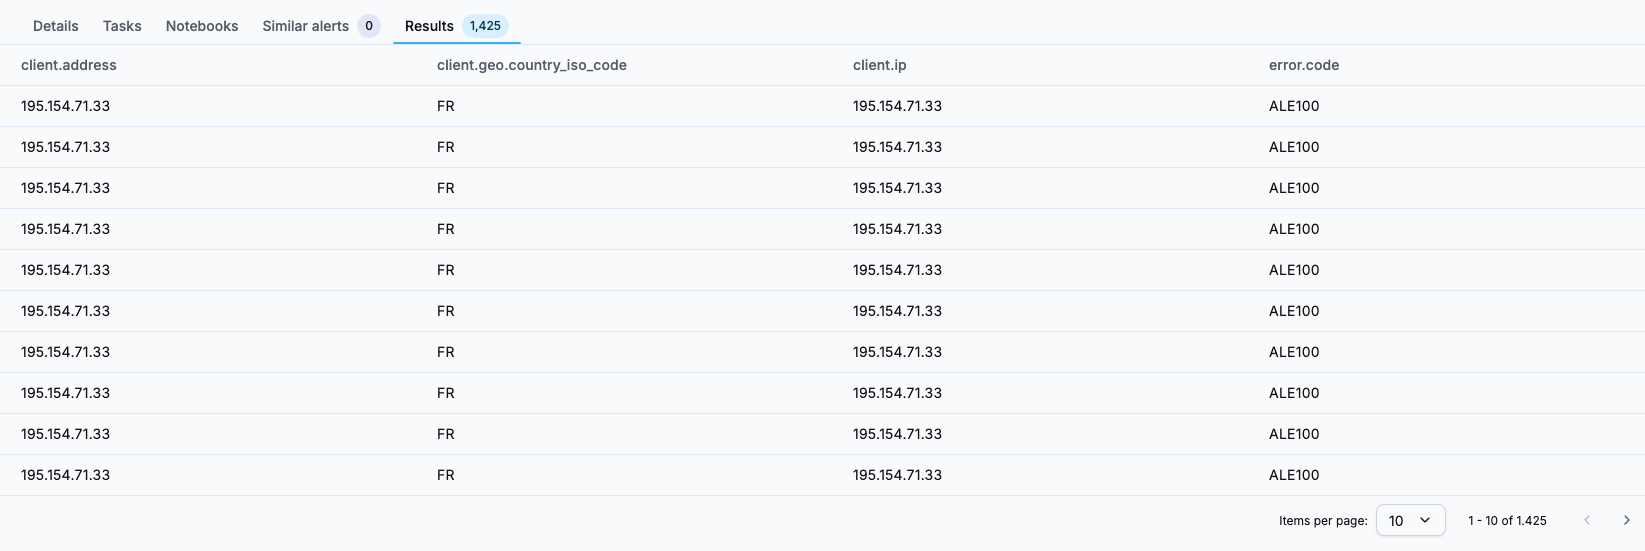
Once saved, your rule begins executing immediately according to its schedule. When the query returns results, an alert is created. You can open any alert generated by a SOL or Event Drop rule to access the Results tab, which shows the raw query results for that execution.
Related articles
- SOL detection rules: Conceptual overview of the SOL and Event Drop detection patterns, how they work, and when to use them.
- Create an Event Drop rule from an intake or asset: Create a pre-filled Event Drop rule directly from an intake or asset details page.
- Alert similarity for SOL detection rules: How SOL rules group matches into alerts, the group-all default, and how to configure a similarity strategy.
- Lag management for SOL detection rules: How rules handle late-arriving events through a fixed run overlap and deduplication.
- Write queries in SOL: Reference guide for SOL syntax, operators, and functions.