Alert details
The alert details page gives you a dedicated workspace to investigate an individual alert. It surfaces the full context of the detection, the raw events that triggered it, related threat intelligence, and the complete analyst action history.
Page header
Click any alert in the alerts listing to open its details page. The header displays the alert's urgency score, name, and short ID, along with the following actions:
- Alert status: move the alert through its lifecycle by selecting a new status.
- Add to case: attach the alert to a case for a broader investigation.
- Playbooks: view and trigger on-demand playbooks associated with the alert.
Note
Only manual playbooks (with a manual trigger) that are enabled in the community appear in the Playbooks list.
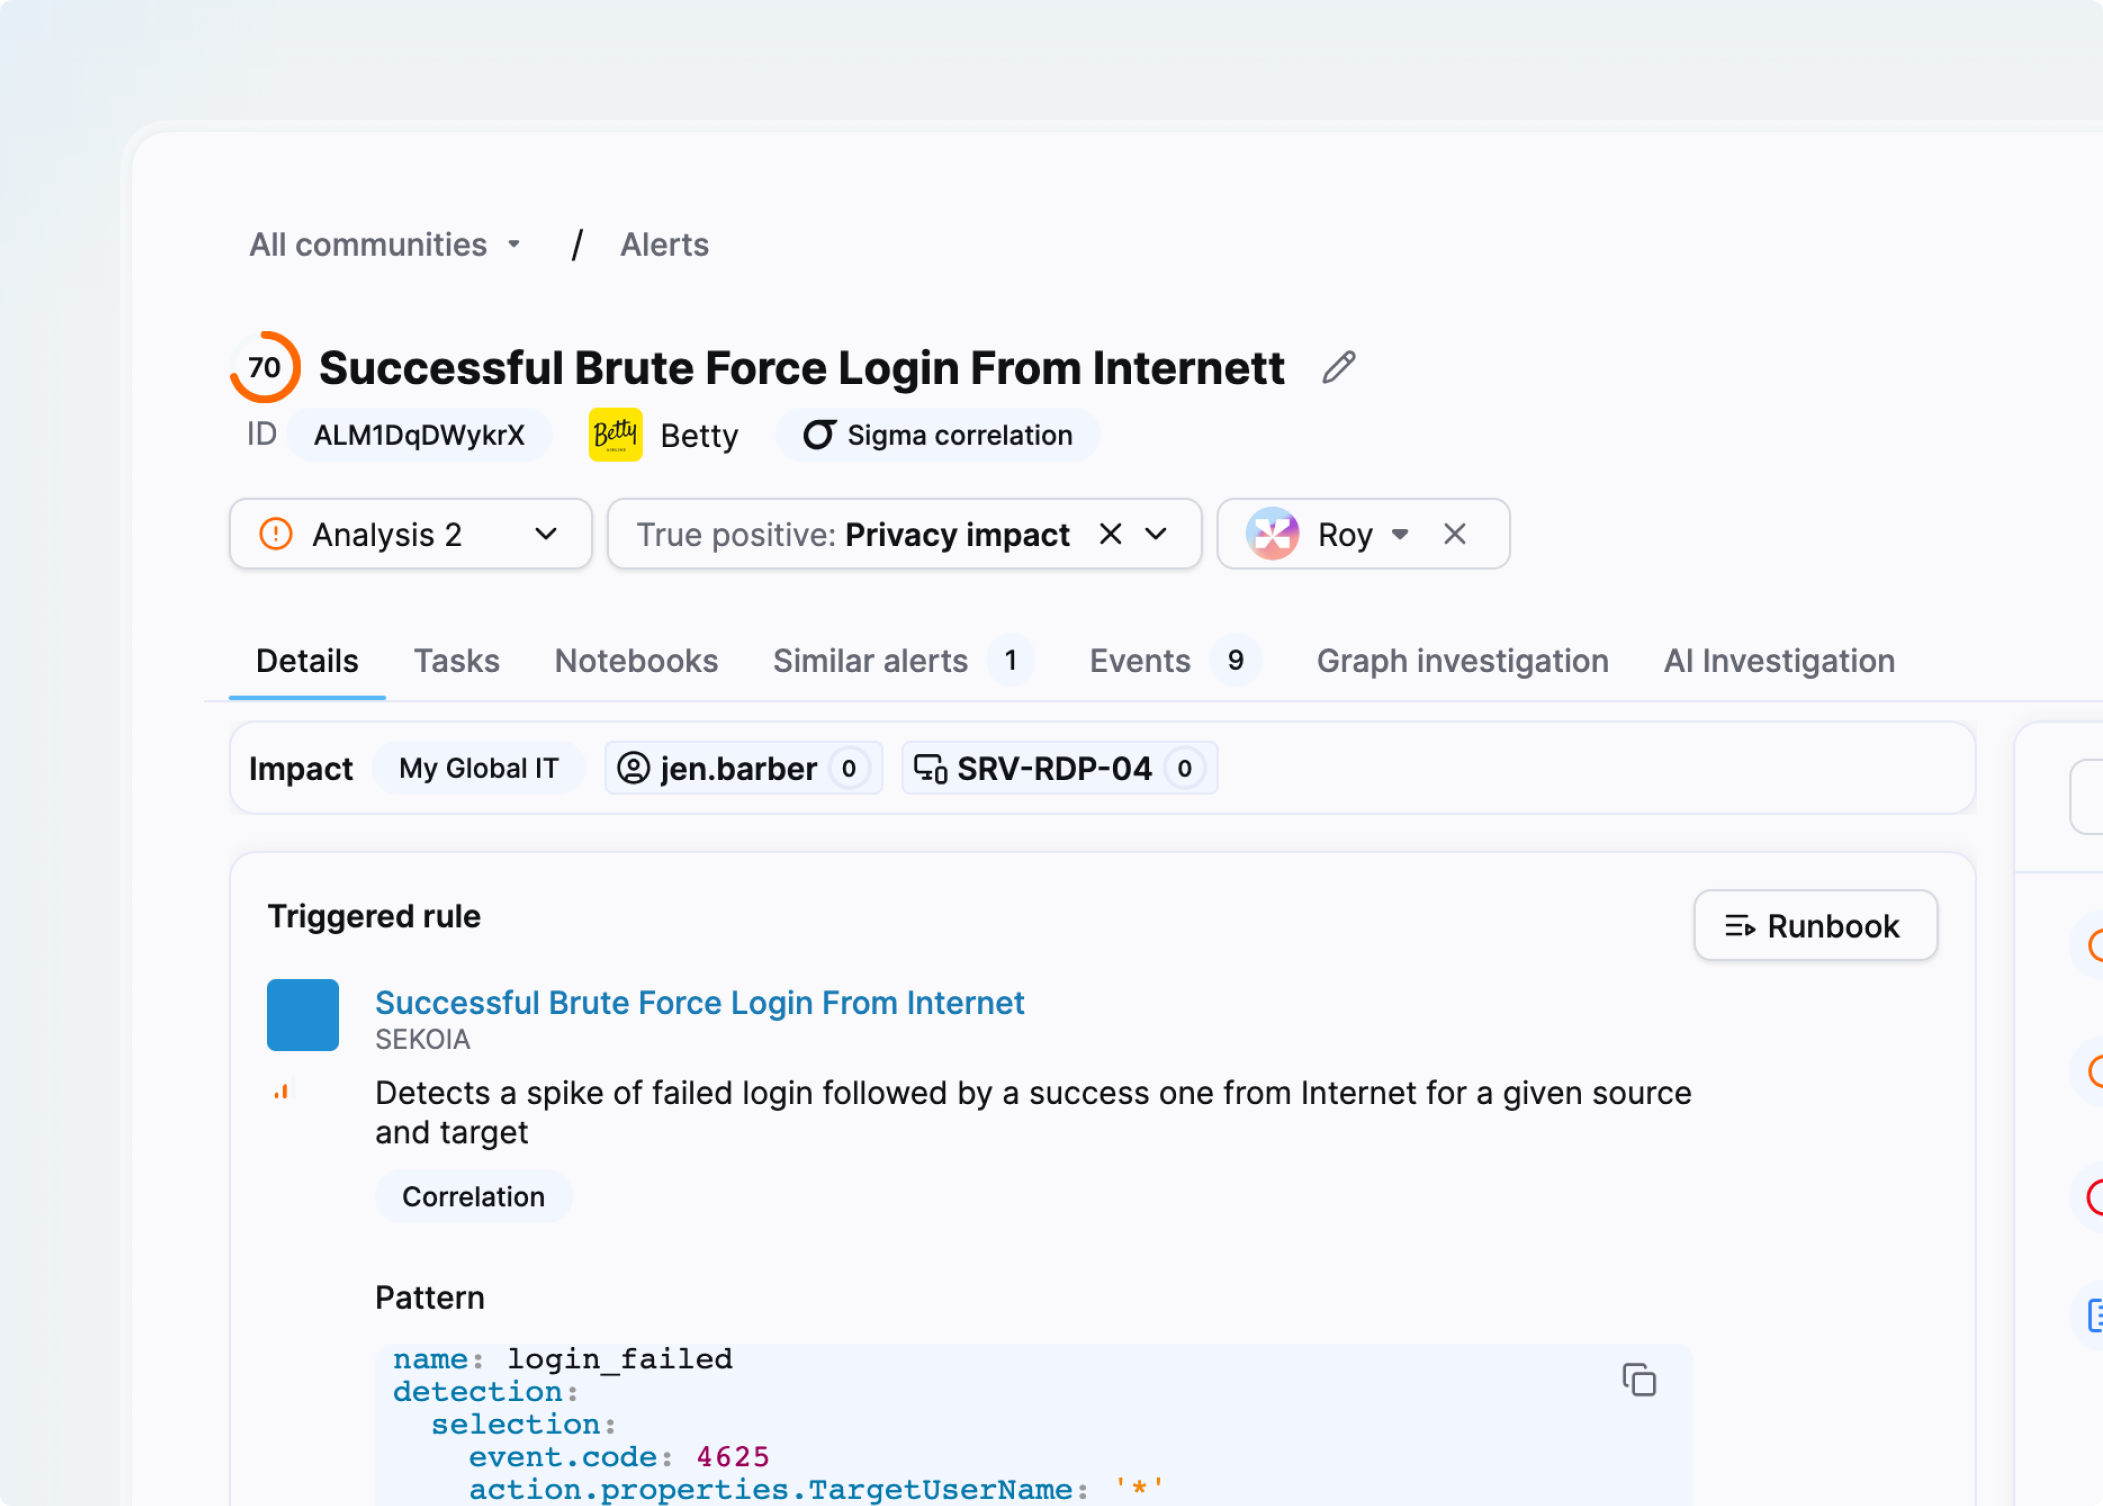
The page is organized into five tabs: Details, Tasks, Similar alerts, Events, and Graph investigation.
Details tab
The Details tab contains the information needed to understand what triggered the alert. It is split into two columns.
The left column displays:
- Urgency score, editable on hover.
- Alert type.
- Impacted assets.
- Impacted entity.
- Similarity strategy used for this alert.
- Related cases.
- Kill Chain phase, editable on hover.
- Rule details for the rule that triggered the alert.
- Threat intelligence from the Intelligence Center for all threats linked to this alert.
- Custom fields attached to the alert.
Custom fields let you capture structured metadata on the alert, such as the number of affected users or the attack vector. Field definitions are shared with cases, so a field created once can be used on both. See Custom fields for supported data types, and Use custom fields to add a value to an alert.
The right column is the timeline, which records the complete history of the alert:
- Status changes.
- Comments (added using the button at the top of the column).
- Events displayed with their Smart Descriptions.
- Completed tasks.
- Rejected tasks.
You can filter the timeline to display only items of a specific type.
Tasks tab
The Tasks tab lists all tasks and subtasks associated with the alert.
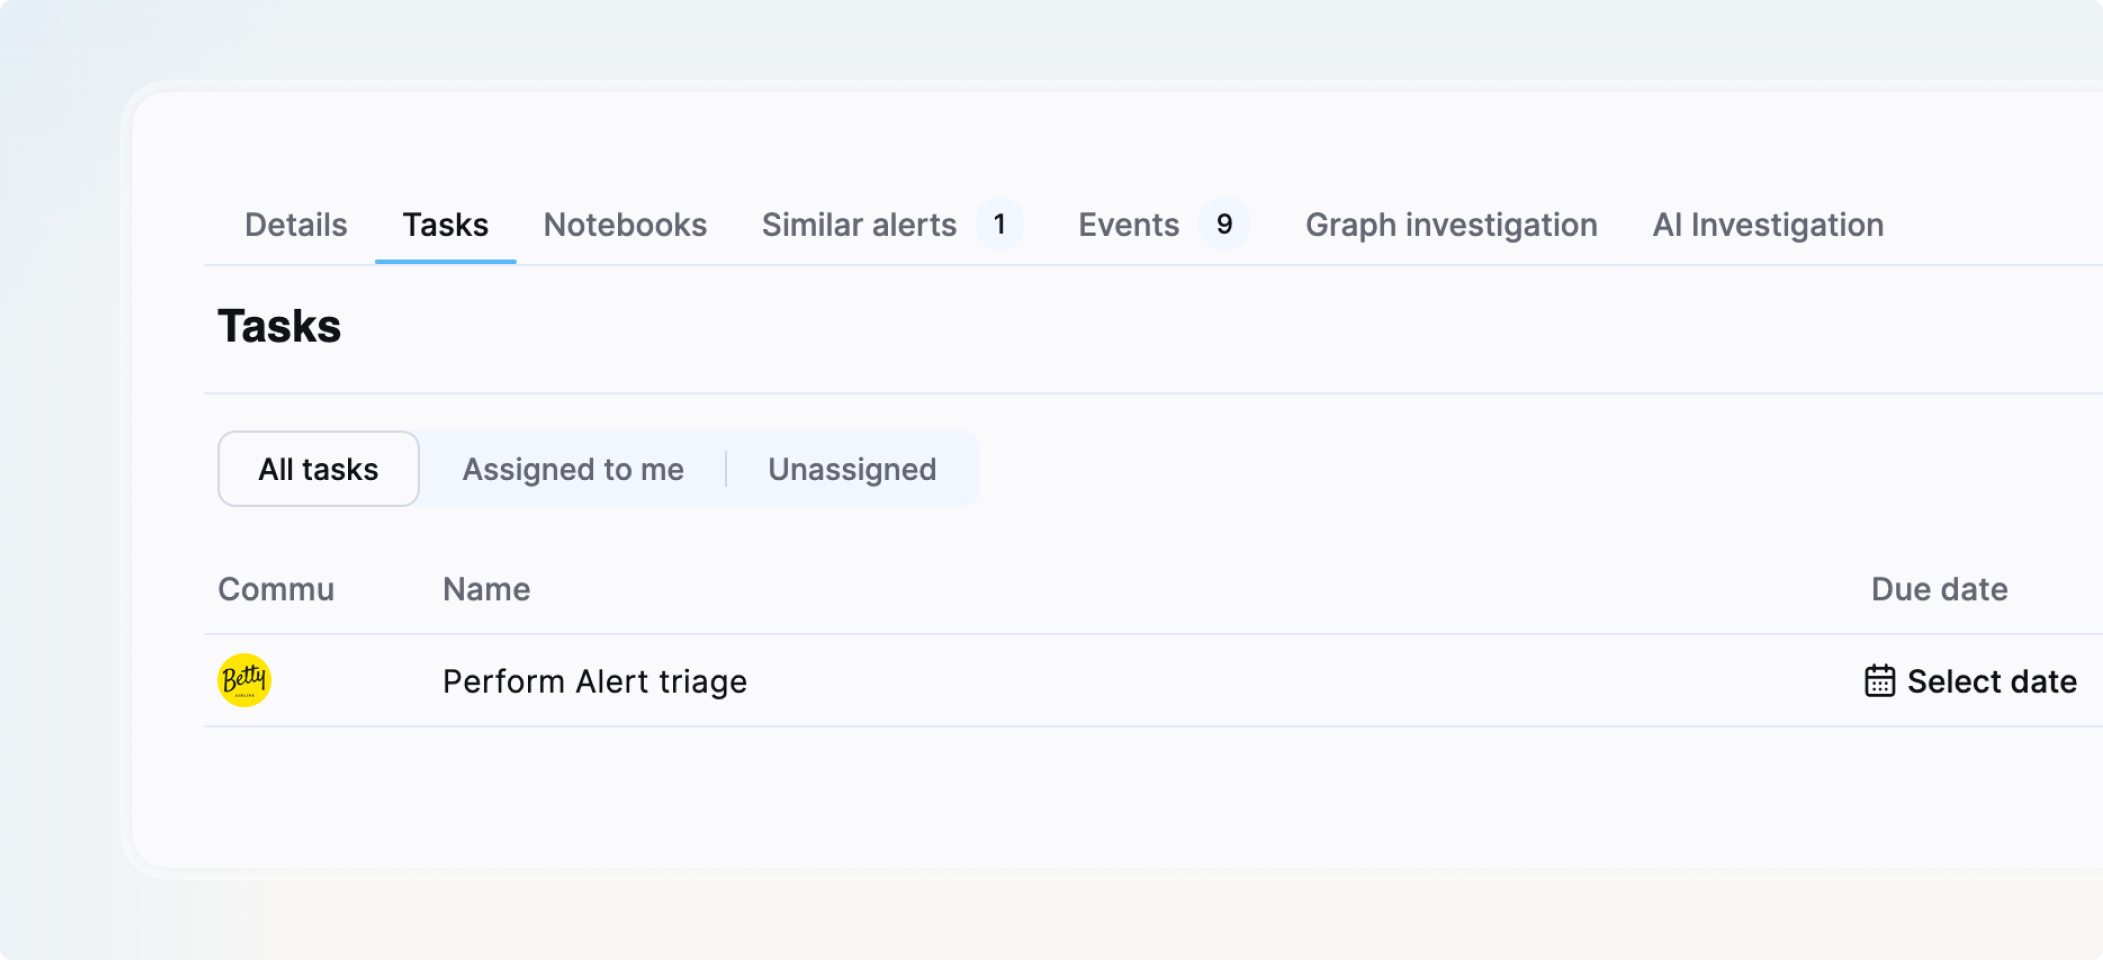
Completing a task informs the Operations Center that you have taken the corresponding action on your perimeter. The alert's urgency score and risk indicator decrease accordingly.
Subtasks may include an OpenC2 specification, visible by clicking the automation icon next to the subtask.
Similar alerts tab
The Similar alerts tab shows previous alerts that match the current alert's similarity criteria. It helps you make faster triage decisions by surfacing how comparable alerts were handled in the past.
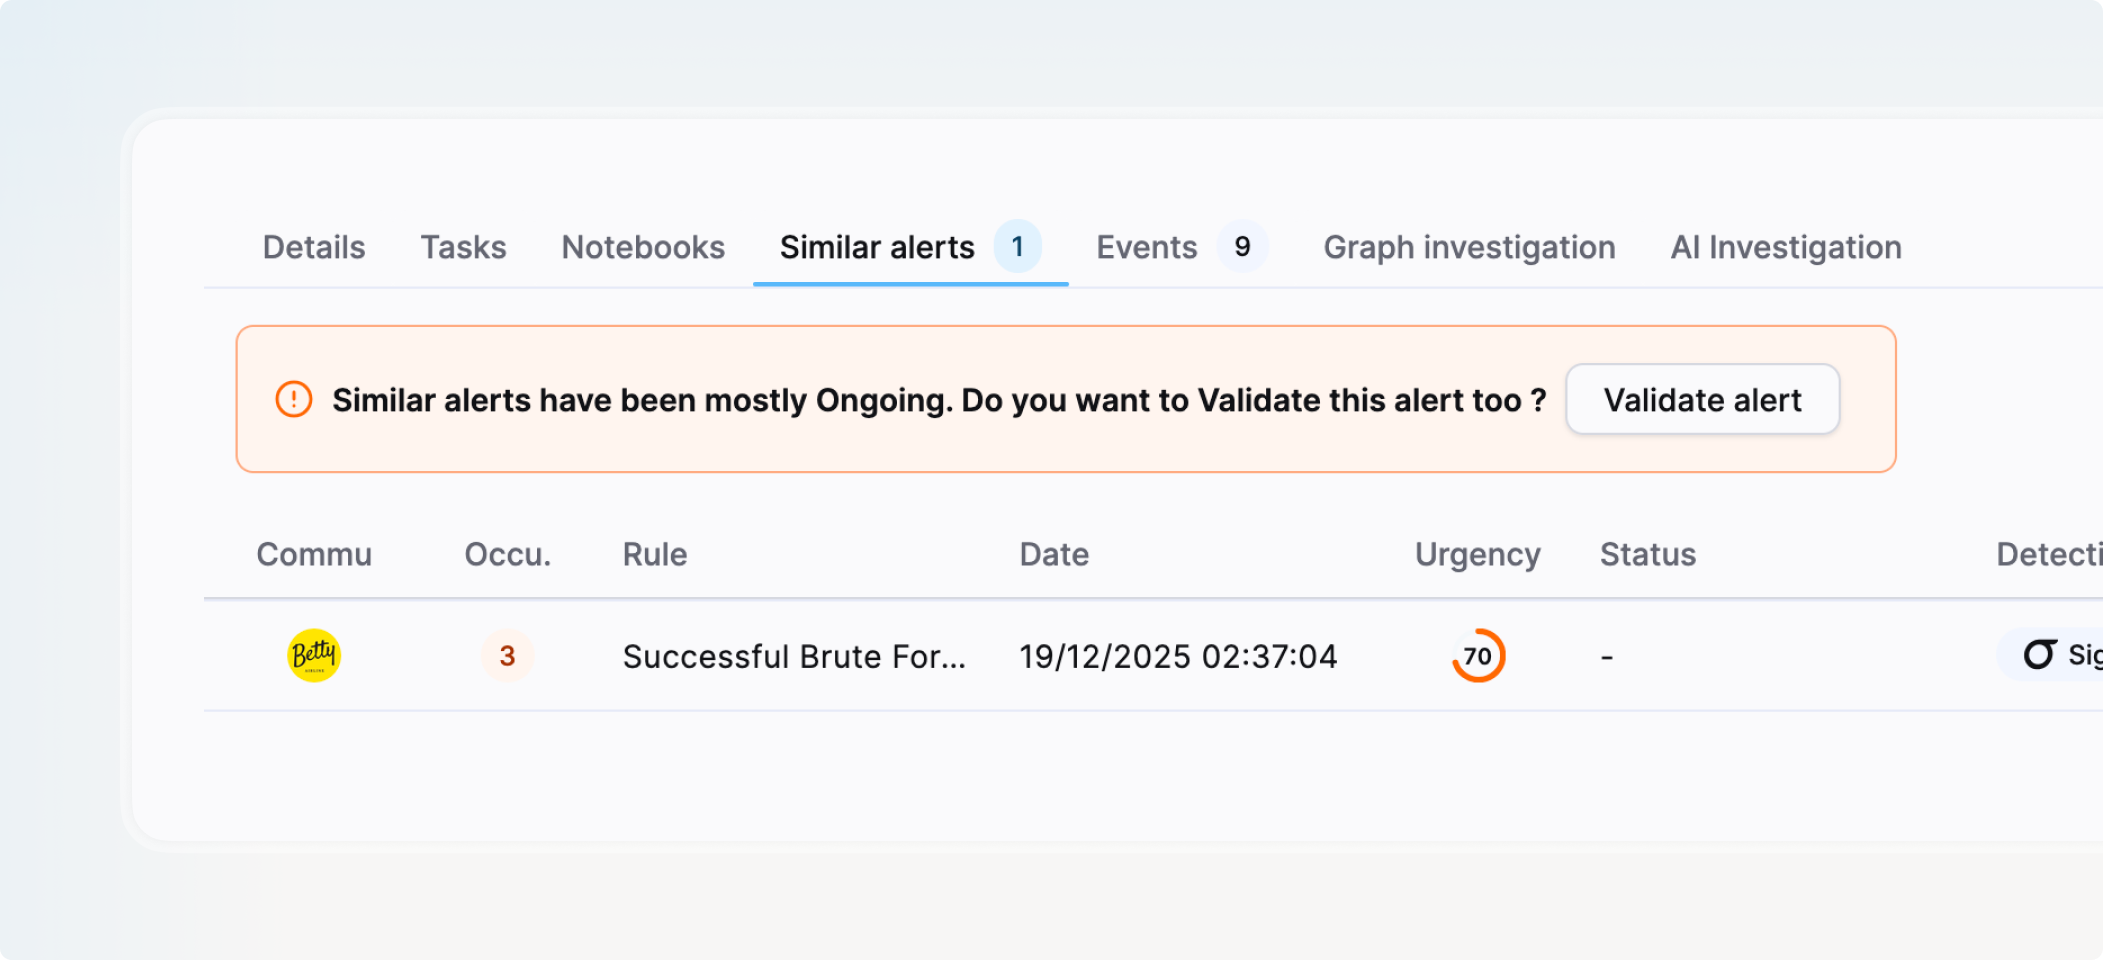
The tab contains two sections:
- Suggestion message: a callout summarizing how the majority of previous similar alerts were handled, with a suggested status and an action button to apply it. This action is not available for alerts in the Closed stage.
- Similar alerts table: lists all matching previous alerts. Customize the columns displayed to compare relevant fields.
Tip
Click any similar alert to view its full details, or open several in new tabs to compare them side by side.
Note
If no previous similar alerts exist, the tab displays a message to that effect.
Events tab
The Events tab lists the events that triggered the alert, using the same display as the Events page.
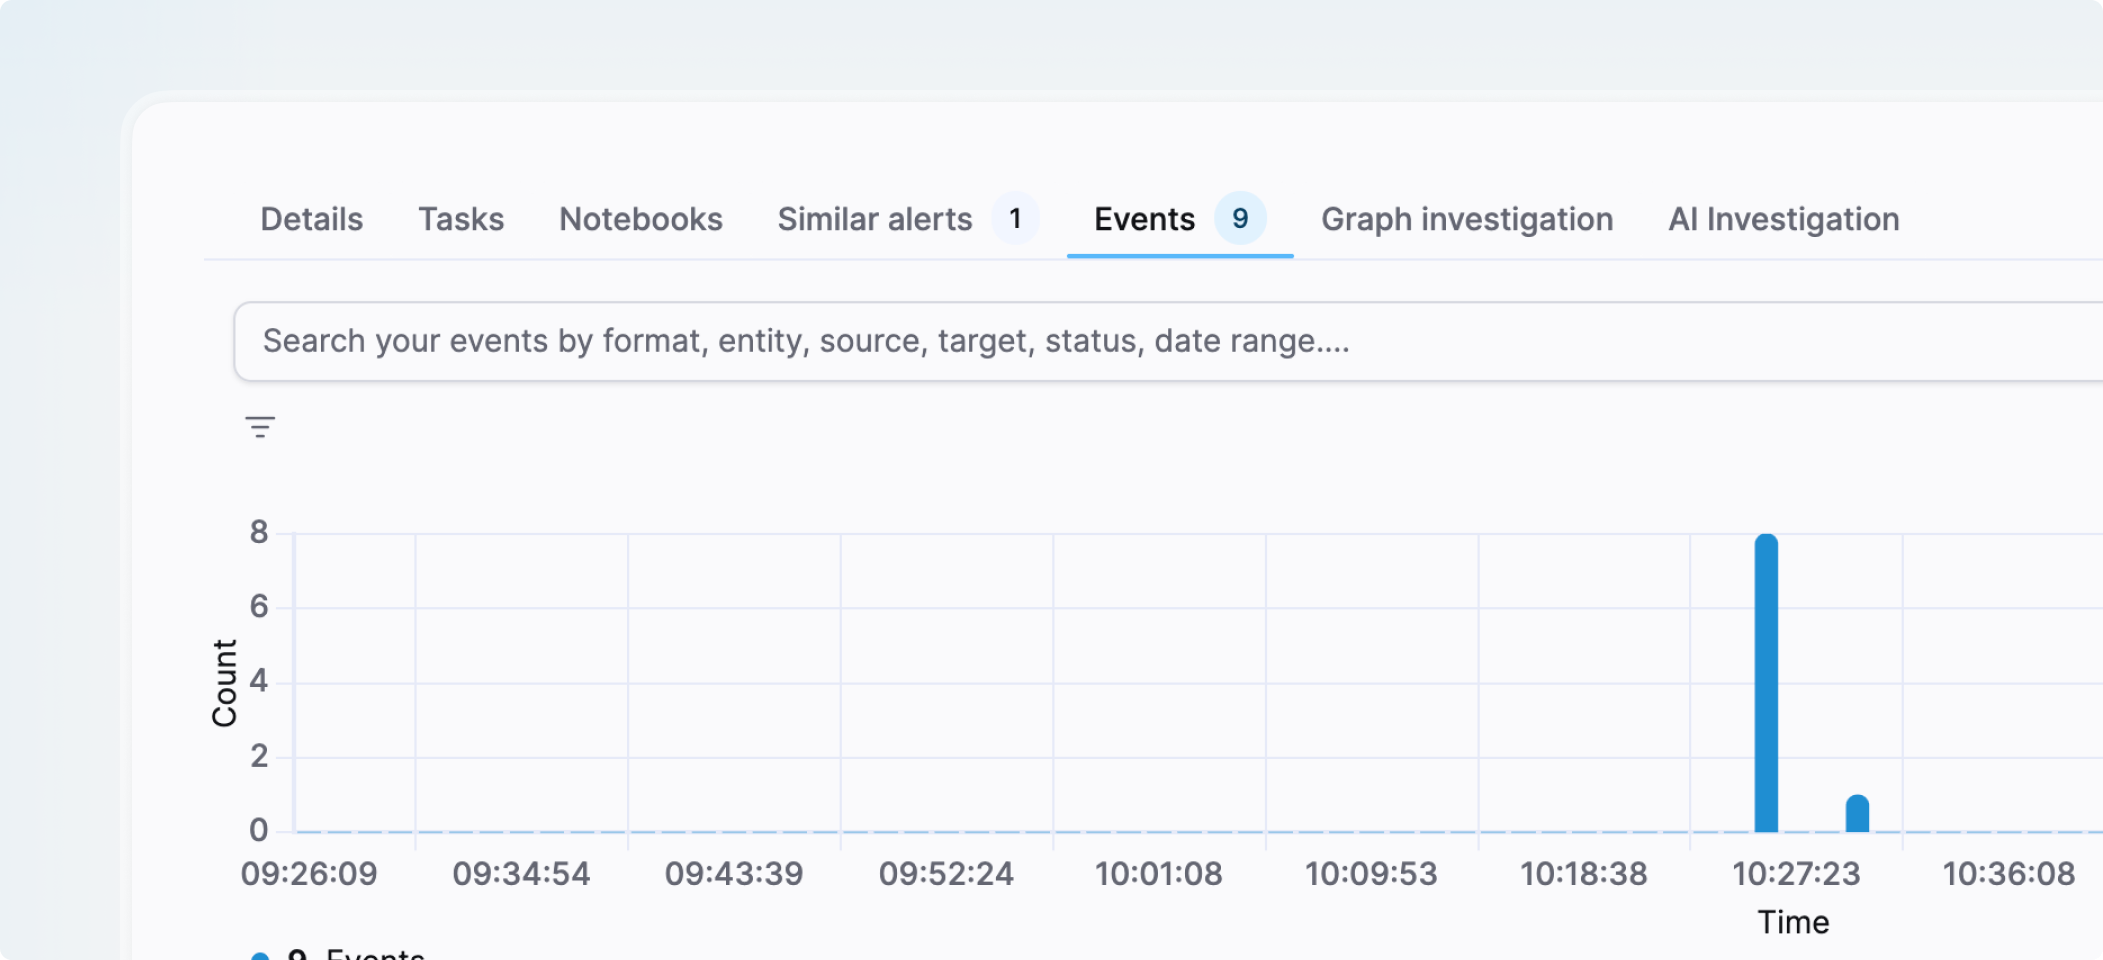
When interacting with an individual field value, you can:
- Filter for: show only events matching this value within the alert.
- Filter out: hide events matching this value within the alert.
- Search events with this value: search for events containing this value across a broader timeframe.
Toggle Value selection mode using the button at the top of the event list to select multiple values at once. Selected values can then be used to create an alert filter or search events.
Create an alert filter
Alert filters prevent known false positives from triggering the same alert again in the future.

- Go to the Events tab.
- Click Toggle value selection.
- Click the values you want to filter on.
- Click Create an alert filter.
- Enter a Name for the filter (required).
- Enter a Description (optional).
- Review the filter pattern, generated automatically from the selected values.
- Click Add to apply the filter to the rule that triggered this alert.
Note
Reject the alert is selected by default, which automatically rejects the current alert after the filter is created.
Search events with a value
This feature searches all events that occurred within the alert's timeframe (±1 hour).
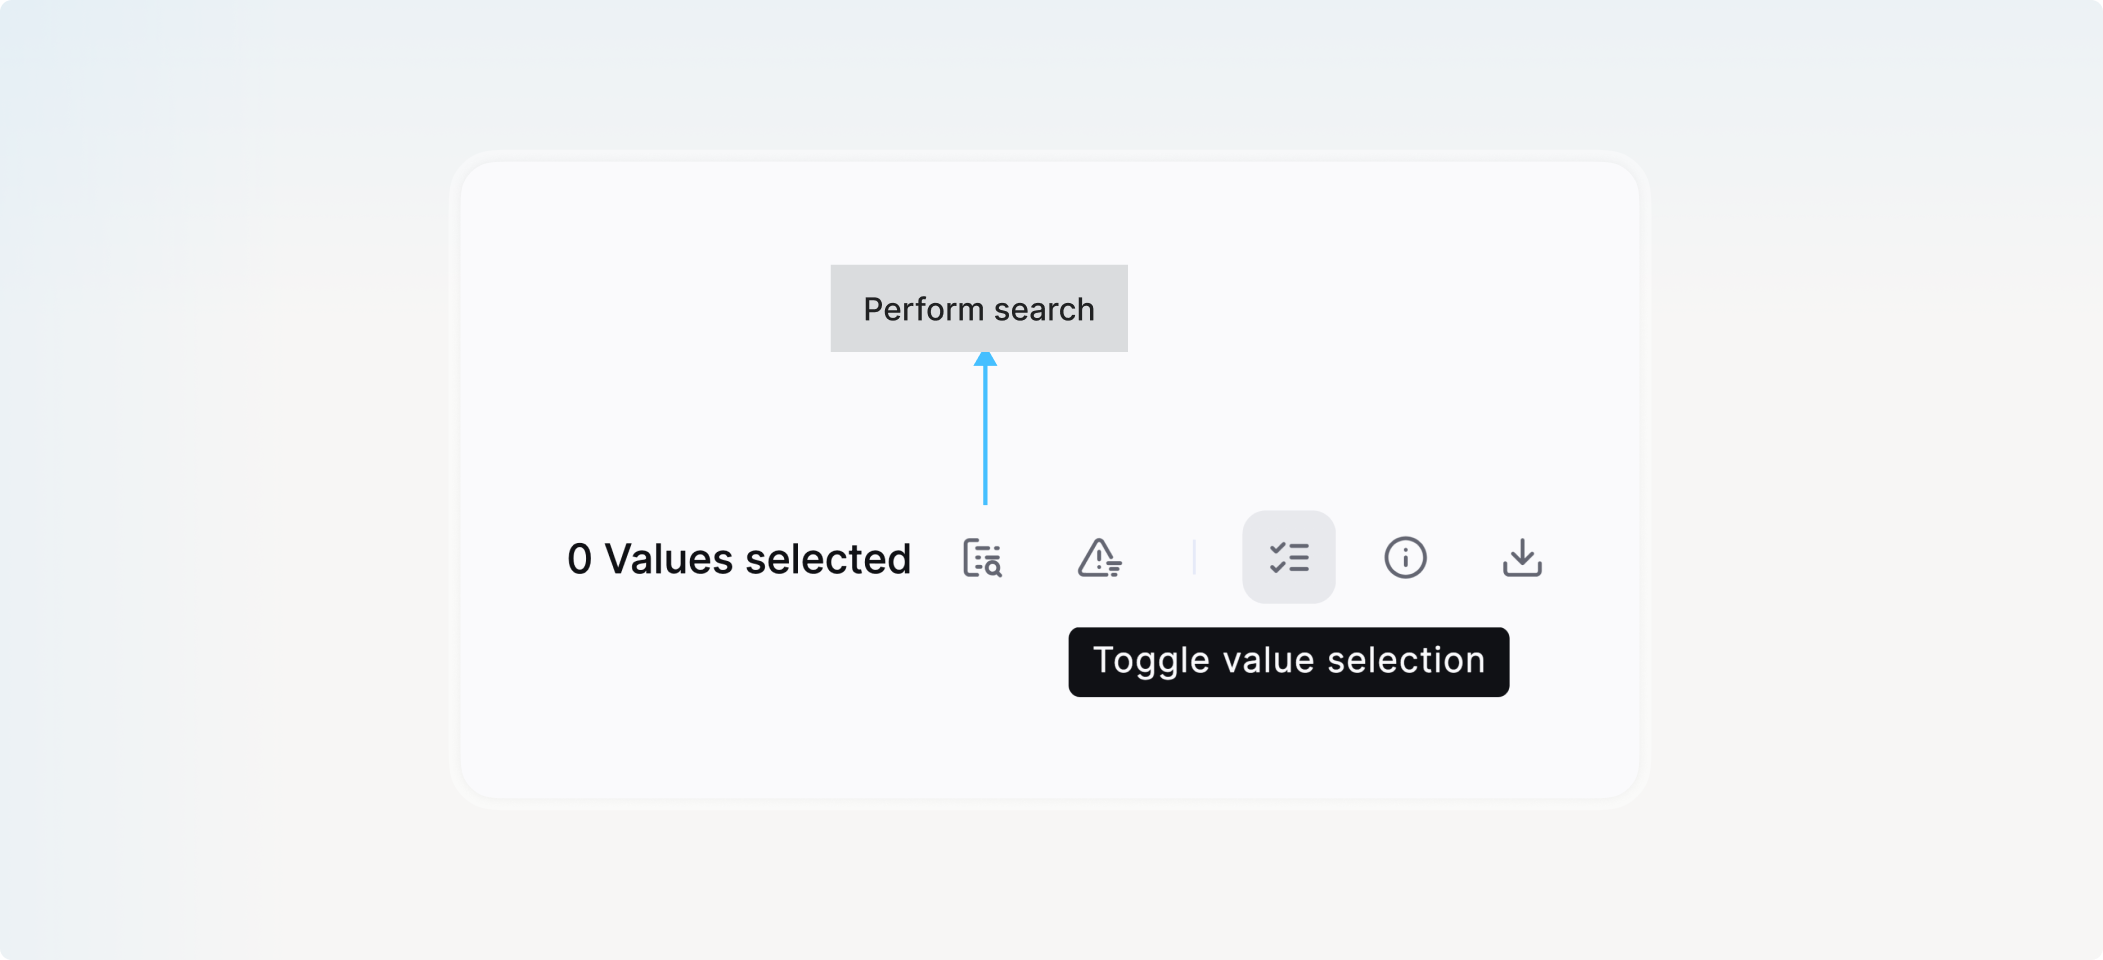
- Go to the Events tab.
- Click Toggle value selection.
- Click the values you want to search for.
- Click Perform a search.
A side panel opens with the results so you can investigate without leaving the alert page.
Graph investigation tab
The Graph investigation tab provides an interactive visualization of the alert, linking security events with threat intelligence data for visual threat analysis.
Note
All changes in the graph are saved automatically. The graph updates on each visit as new events are processed, and newly discovered objects are integrated into the existing structure.
Graph elements
The graph displays the following elements:
- Observables: security artifacts extracted from events, including IP addresses, domain names, URLs, user accounts, file hashes, and other indicators of compromise.
- Observable relationships: directional arrows between observables, derived from events using Smart Description definitions.
- CTI objects: STIX-compliant threat intelligence objects from the Intelligence Database that provide contextual information about the threats involved.
- STIX relationships: standardized connections between threat intelligence objects.
Threat intelligence
Click any CTI object in the graph to display its details in the left panel:
- Object description and threat context.
- Relationship mappings with other intelligence objects.
- Options to expand the graph by adding related objects.
This lets you pivot through the threat intelligence database to explore related threats and campaigns.
Observable analysis
Click any observable node to display its details in the left panel:
- Event context: all events in the alert that contain this observable, shown with Smart Description summaries.
- Full event details: accessible from the right panel via Full events.
- Extended search: a direct link to search for additional events containing this observable across your environment.
Layers
Layers let you organize a complex graph into focused groups that can be displayed independently or together, reducing visual clutter during investigations.
Every graph automatically creates a default layer on first access. This layer contains the initial graph elements, incorporates new objects as additional events are processed, and persists across sessions.
Create and manage layers
- Click the default layer name in the graph (for example, Event Layer #1).
- Click + to add a new layer.
- Enter a name for the layer.
- Drag observables or objects into the layer.
All changes are saved automatically. To focus on a single layer, click the Eye icon to toggle the visibility of other layers.
Layer strategies
Consider organizing layers by:
- Observable type: separate layers for network indicators, file artifacts, and user activities.
- Time period: layers organized chronologically to understand attack progression.
- Suspected threat actor: separate layers when multiple actors or techniques are identified.
Additional layer actions include renaming layers, moving objects between layers, and using the built-in search to locate specific objects in large graphs.
Related links
- Alerts: Overview of how alerts work, including urgency calculation, similarity strategies, and types.
- Alerts listing: How to browse, filter, and act on alerts from the alerts table.
- Cases: How to create and manage cases grouping multiple alerts.
- Custom fields: Reference for adding structured metadata to alerts and cases.
- Events: How to browse and search raw events.